TABULAR PRESENTATION OF DATA
Raw Data
| Ungrouped Data | Grouped Data | |||
| Ages | Ages | f or | Ages | f |
| 25 | 18 | 2 | 18-19 | 5 |
| 45 | 19 | 3 | 20-21 | 23 |
| 22 | 20 | 11 | 22-23 | 22 |
| 23 | 21 | 12 | 24-25 | 6 |
| 46 | 22 | 15 | 26-27 | 4 |
| 84 | 23 | 7 | 28-29 | etc. |
| 12 | 24 | 4 | 30-31 | |
| 2 | 25 | 2 | 32-33 | |
| 34 | 26 | 3 | 34-35 | |
| 15 | 27 | 1 | etc. |
* note the difference
is width of category; 1 versus 2 years
| Ages | f |
| 18-31 | 72 |
| 32-45 | 45 |
| Age to last Birthday | Age to nearest Birthday | ||||||||
| Age limits | True limits | midpoint | Age limits | true limits | midpoint | ||||
| 18-19 | 18.00-19.999 | 19.00 | 18-19 | 17.50-19.4999 | 18.5 | ||||
| 20-21 | 20.00-21.999 | 21.00 | 20-21 | 19.50-21.4999 | 20.5 etc. | ||||
m (for continuous variables)
=
m (for discrete variables)
=
*midpoint: abbreviated : "m"
*discrete variable: the variable's unit of measure cannot be divided infinitely
*continuous variable: the variable's unit of measure
that can be divided infinitely.
GRAPHING DATA
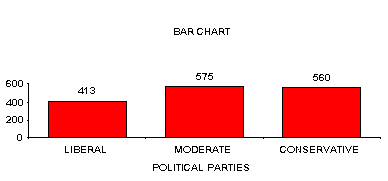
B. Bar graph -- for nominal data (or ordinal)

SOURCE: GSS91 SURVEY SUBSAMPLE
C. Pie Chart -- for nominal data (or ordinal)
SOURCE: GSS91 SURVEY SUBSAMPLE
*Double hatch marks indicate interruption in
the consistently equal intervals. In this case the earliest age
in the sample was 15. The double hatch marks indicates that the
range 0-9.99 was skipped in the polygon.
D. Frequency polygon -- for interval data
TYPES OF DISTRIBUTION
A. unimodal = one peak (mode)

B. bimodal = 2 modes

C. Skewed distributions are unimodal distributions
which are not symmetrical. A positively skewed distribution will
have a mean that is greater in value than its median. Its tail
will fall on the side of the larger values. A negatively skewed
distribution will have a median that is greater in value than
it's mean. Its tail will fall on the side of the smaller values.
A normal curve skew measures 0, while a positive skew measure
is a positive value and the negative skew measure is a negative
value.


D. Degree of kurtosis -- more dense or peaked distributions
than the Bell curve are called leptokurtic. Flatter distributions
than the Bell curve are called platykurtic. A normal kurtosis
measures 0. A positive value of kurtosis describes a leptokurtic
distribution, while a negative value of kurtosis describes a platykurtic
distribution.

